Pierre-Yves de Müllenheim
Home
About
Scientific works
Publications
Preprints
Communications
Posts
Blog
LinkedIn
Categories
All
(2)
Correlation
(1)
Data visualization
(1)
R
(1)
actigraph
(1)
actilife
(1)
counts
(1)
vector magnitude
(1)
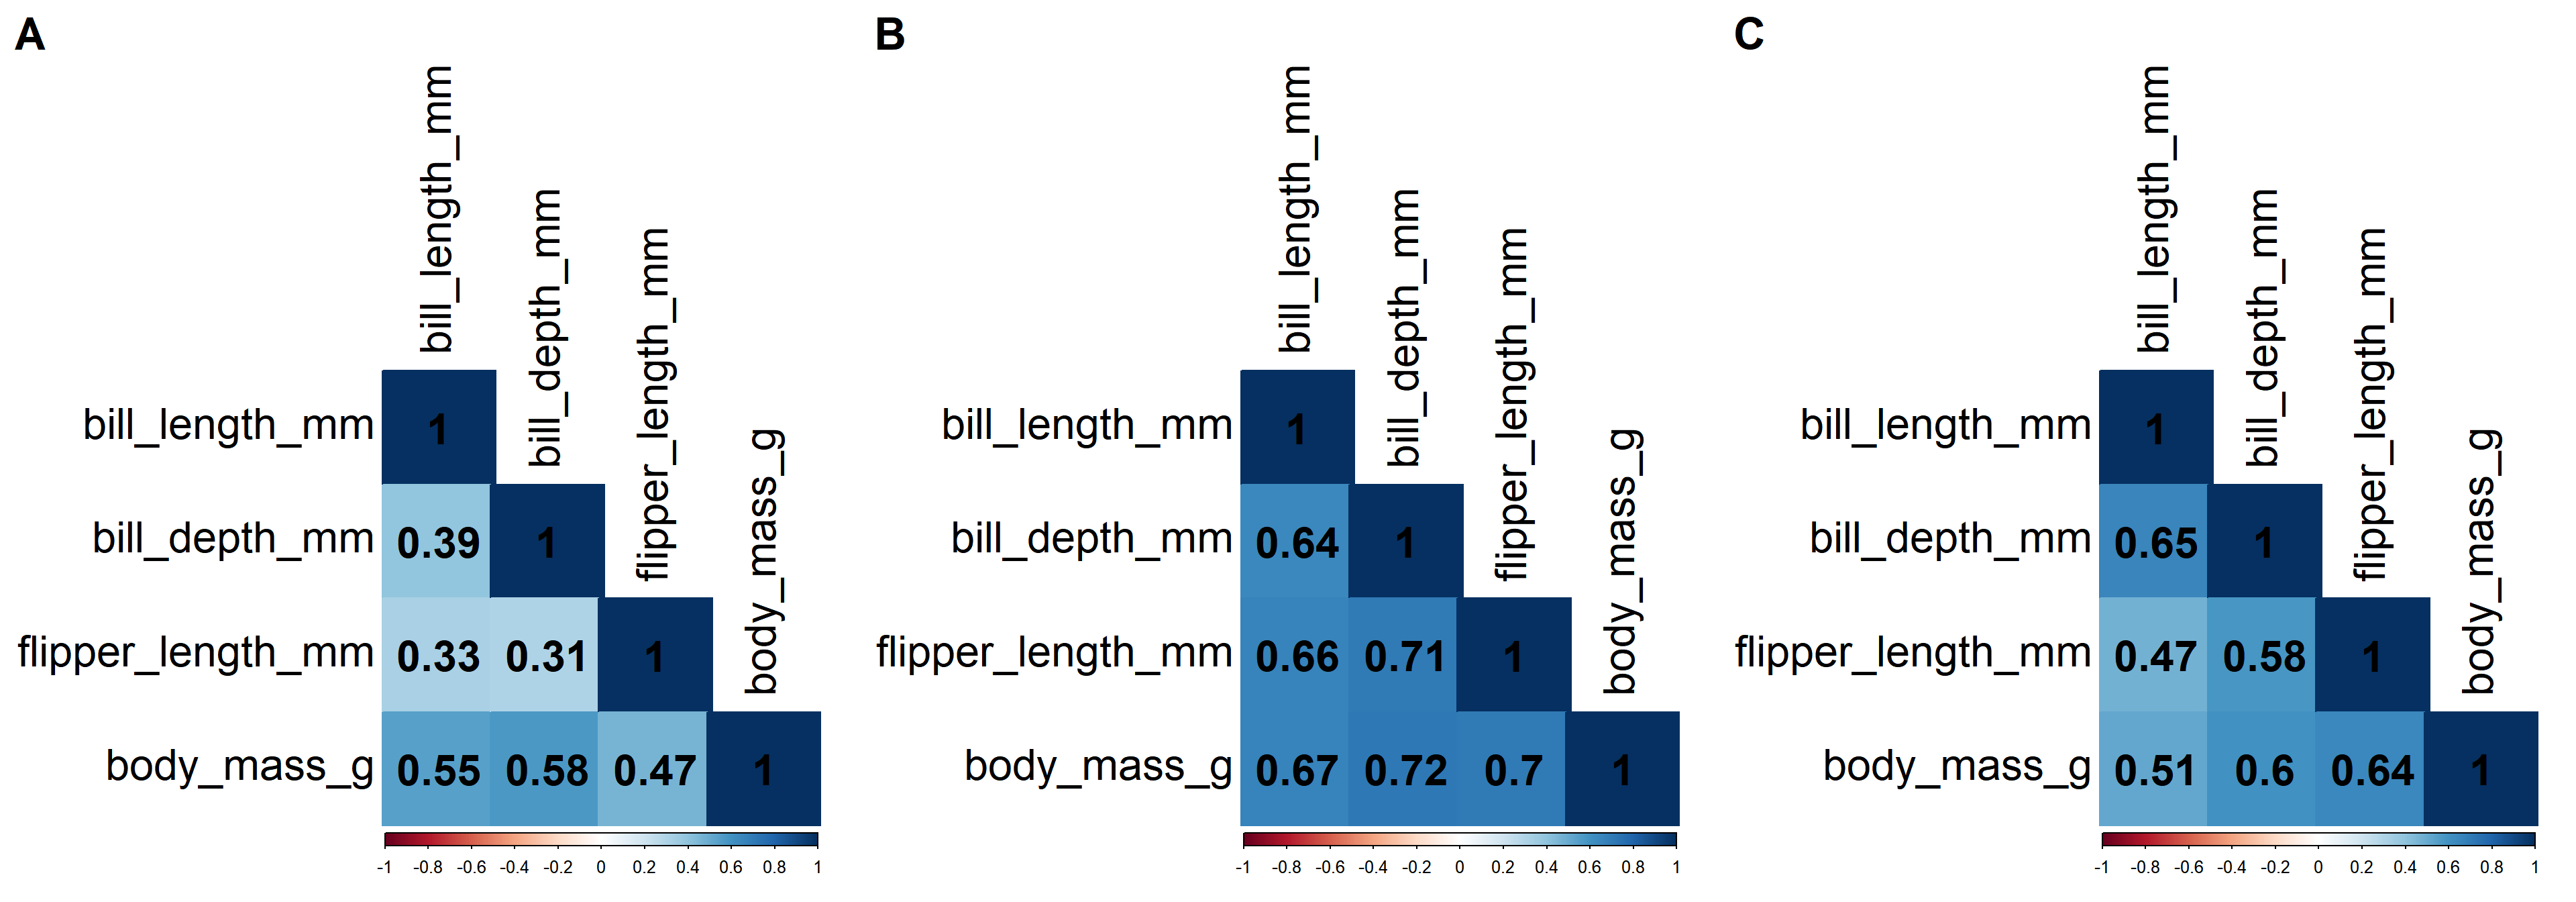
How to make a figure with several panels that include plots that are initially invisible? The case of the {corrplot} package
R
Data visualization
Correlation
Multi-panel figure using plots from {corrplot}
Nov 15, 2022
Pierre-Yves de Müllenheim
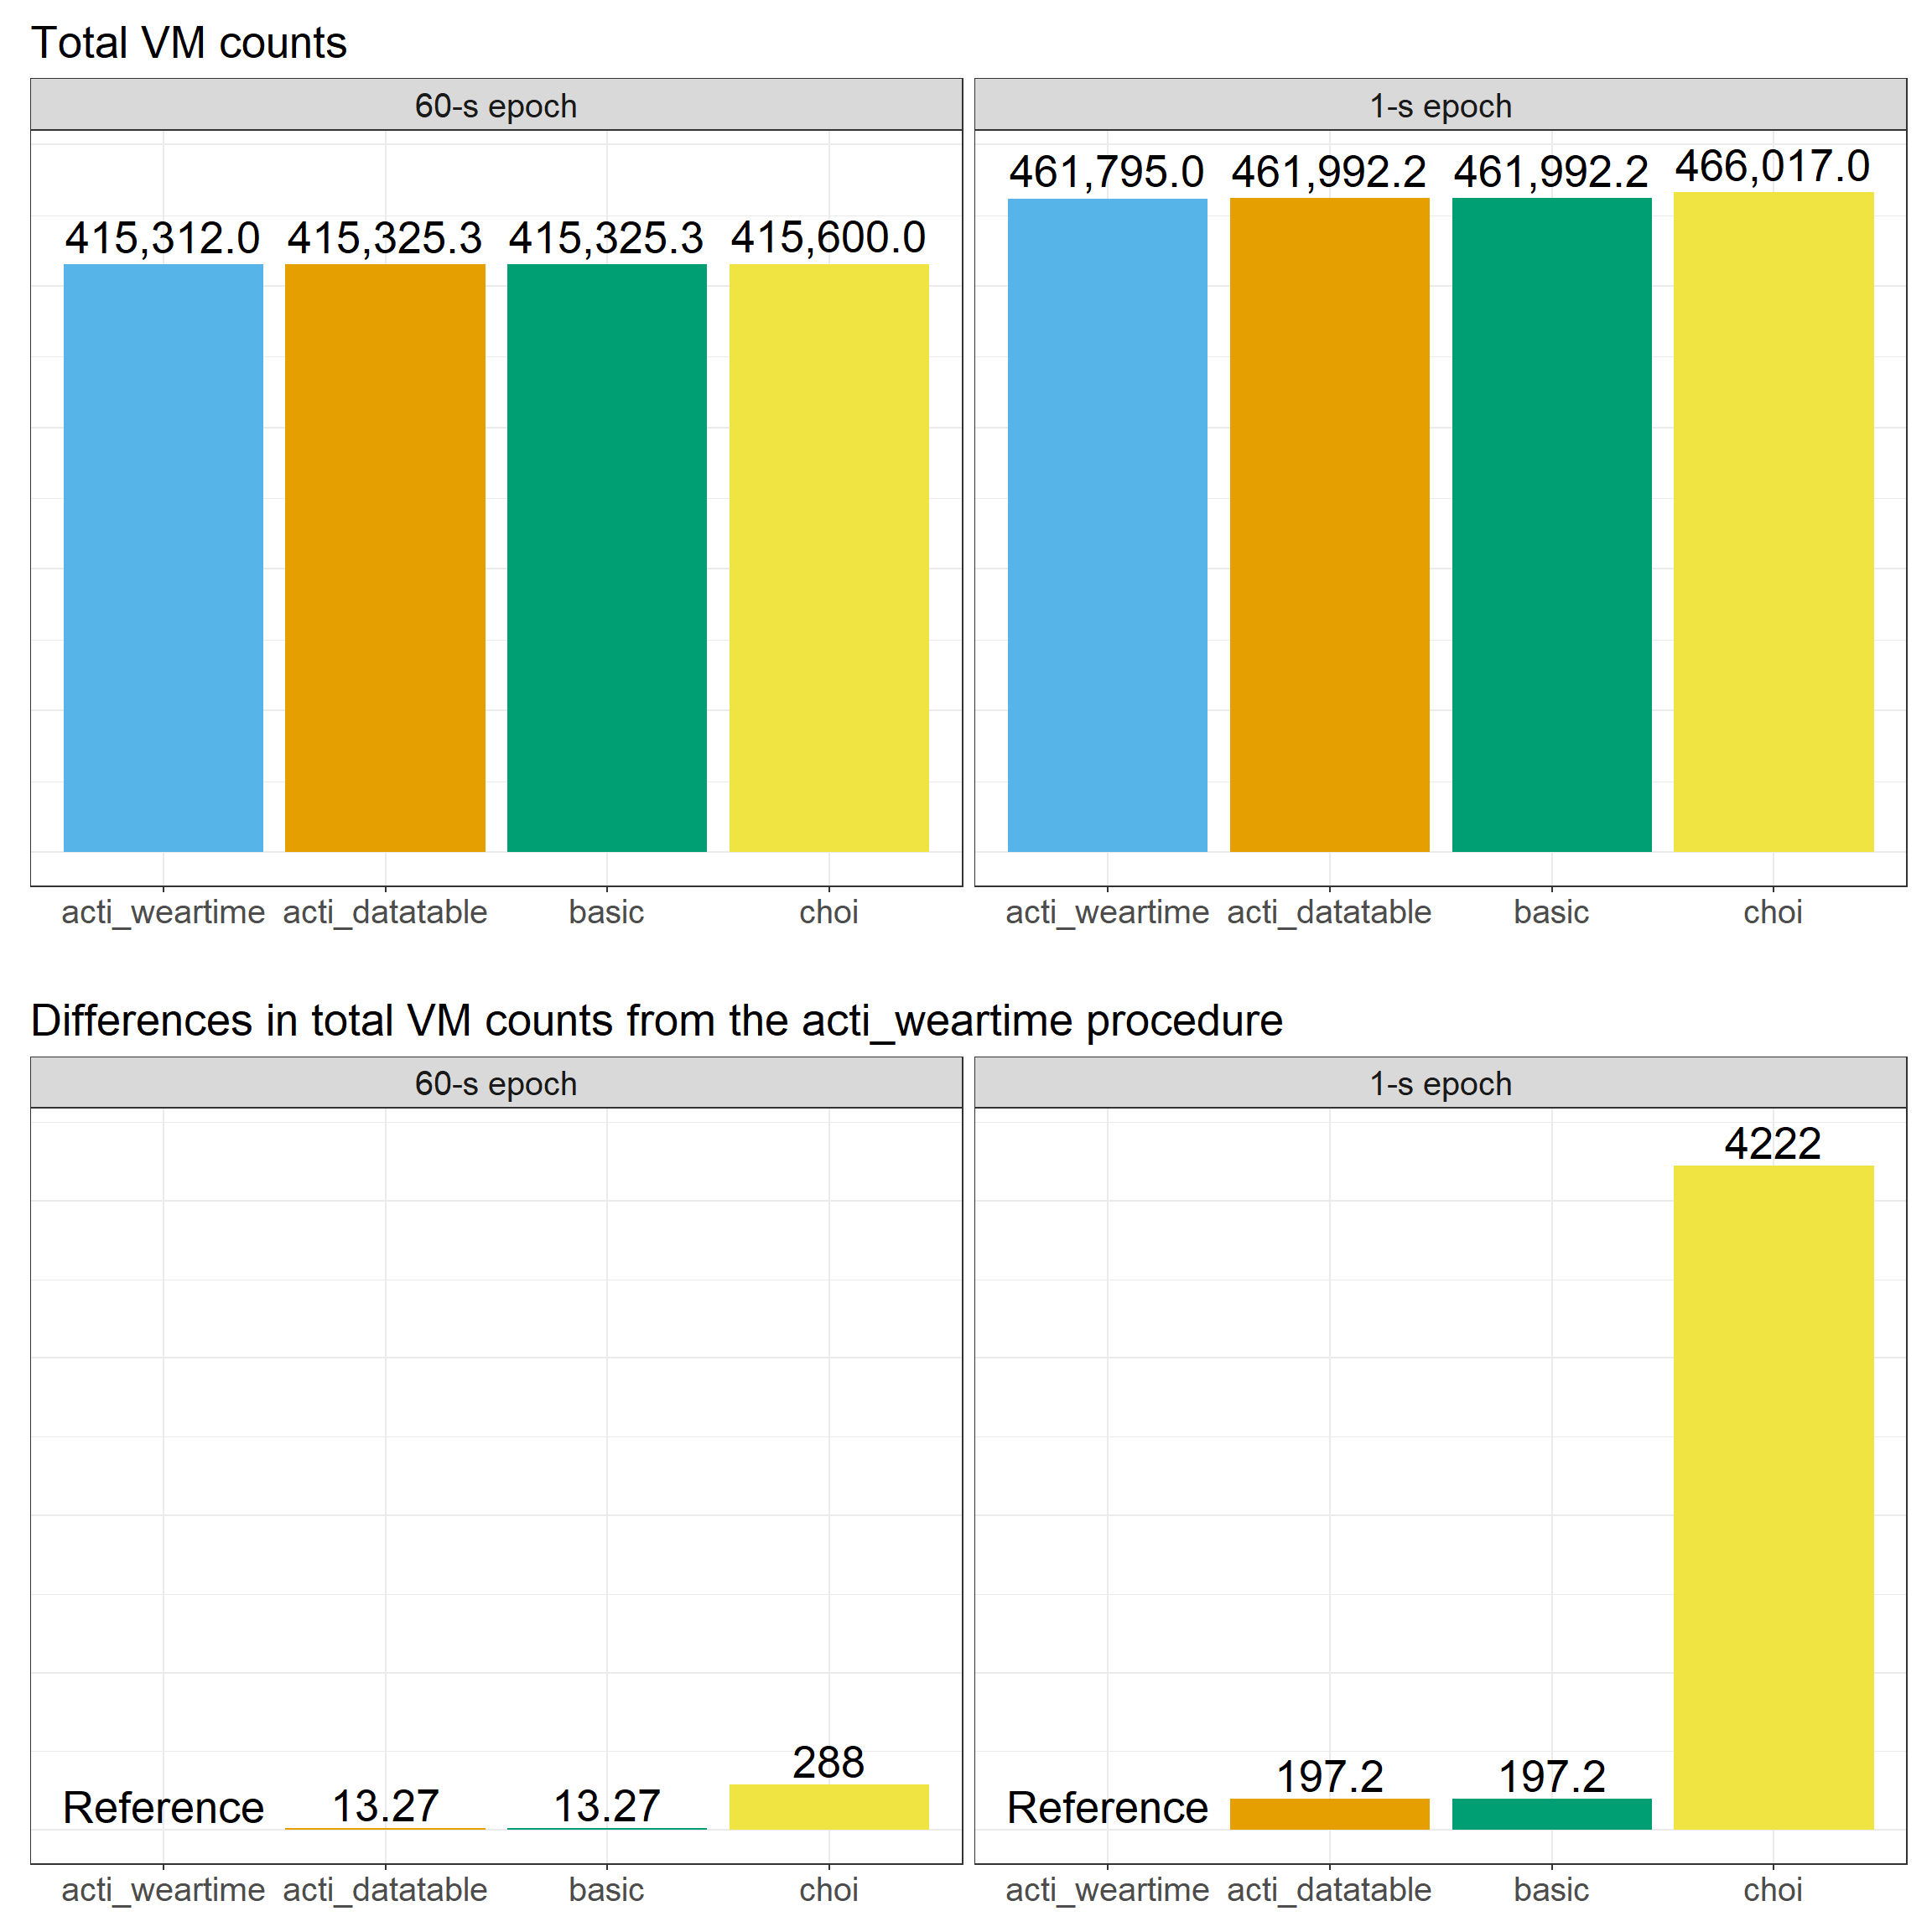
Actilife software procedures to get vector magnitude counts: are the computations exactly the same?
actigraph
actilife
counts
vector magnitude
Exploring how vector magnitude is computed by Actilife software
Jul 1, 2022
Pierre-Yves de Müllenheim
No matching items